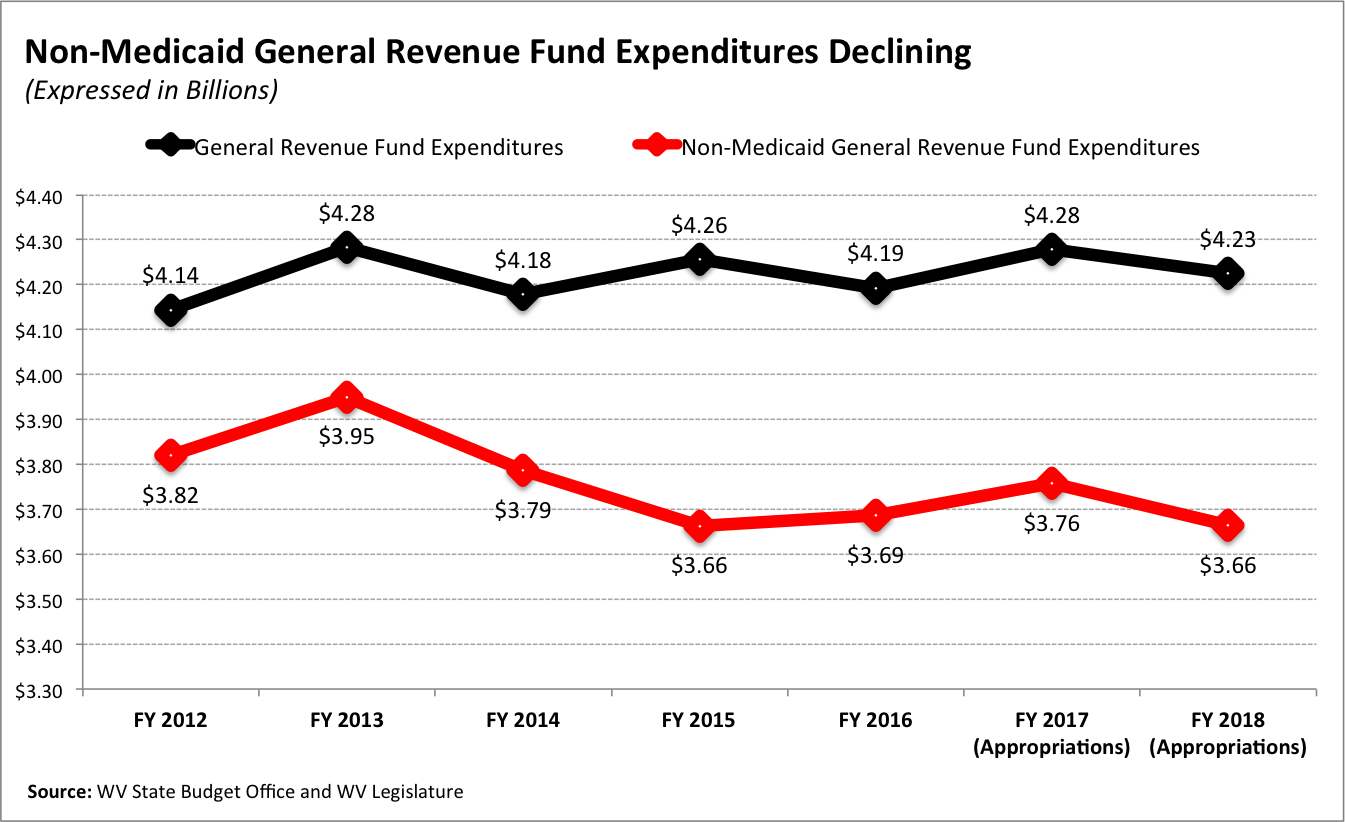
When lawmakers passed a “bare-bones” state budget, some lawmakers expressed that the state government needs to “live within its means” because of our “shrinking population and tax base.” Other lawmakers have suggested that our state budget is too big and that we will need to “continue making cuts to programs and services” and that we should not place “additional tax burdens on our citizens.” What many of these lawmakers neglected to mention is that our state budget has already been drastically reduced over the last several years and that our tax levels are at an all-time low. Even with our state’s declining population, our per capita spending has declined over the last several years, after adjusting for inflation. While the number of state employees has grown over the last decade, almost all of the growth has been in higher education, which is mostly funded with tuition and fees that aren’t appropriated by lawmakers. State employees funded by the General Revenue Fund, the part of the budget that contains most of the state taxes that support our biggest programs, is at a 10-year low. State Budget Spending Down, Not Up Before I show how state spending has changed over the past decade, it first important to understand the different spending accounts or “funds.” There are six main accounts and each of them derive their revenue from different places, including the General Revenue Fund (mostly taxes), Special Revenue (mostly dedicated fees and some taxes), Lottery Funds (games), State Road Funds (gasoline tax/DMV fees/federal taxes), Federal Funds (income/payroll taxes), and Non-Appropriated Special Revenue Funds (dedicated fees). While each is important (See Your Guide to the State Budget for more details), the General Revenue Fund (GRF) pays for most of the state’s key budgetary items (e.g. Public Education, Higher Education, Corrections, etc.) and is the source of most of the taxes we pay to maintain government services. The GRF is also the part of the budget legislators have the most control over and it is where most of the budget debate takes place each year. As the chart below shows, General Revenue Fund appropriations for 2018 are slightly below actual spending in 2013. If you adjust for inflation, the state plans to spend about $350 million less in 2018 than it did in 2013 and $268 million less than it did ten years ago in 2008. (The central reason GRF spending declined in 2010 and 2011 was because of hundreds of millions of additional federal dollars from the stimulus (ARRA) that were used to back-fill spending for higher education, public education, and Medicaid.) 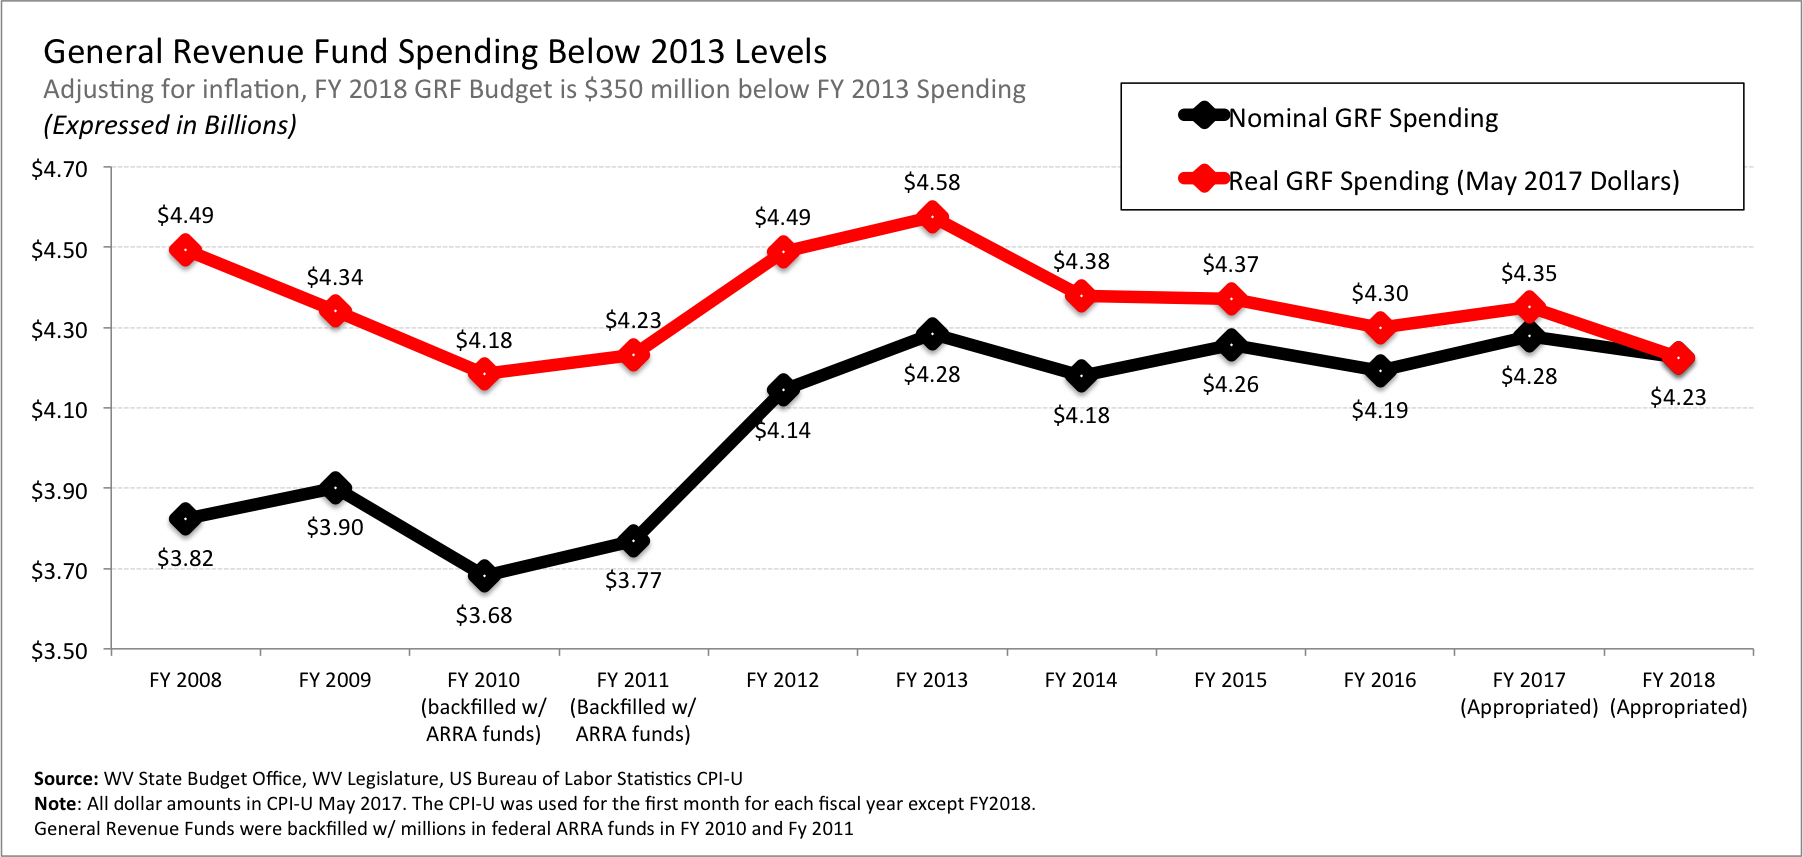 If you look at GRF spending over the last six years with and without Medicaid, it is clear that Medicaid is one of the only growing parts of the state budget and that is largely responsible for any increases in spending since 2012. The growth in Medicaid spending is mostly due to rising health care costs and the depletion of the Medicaid Trust Fund that was built up from a higher federal match rate (FMAP) from the stimulus.
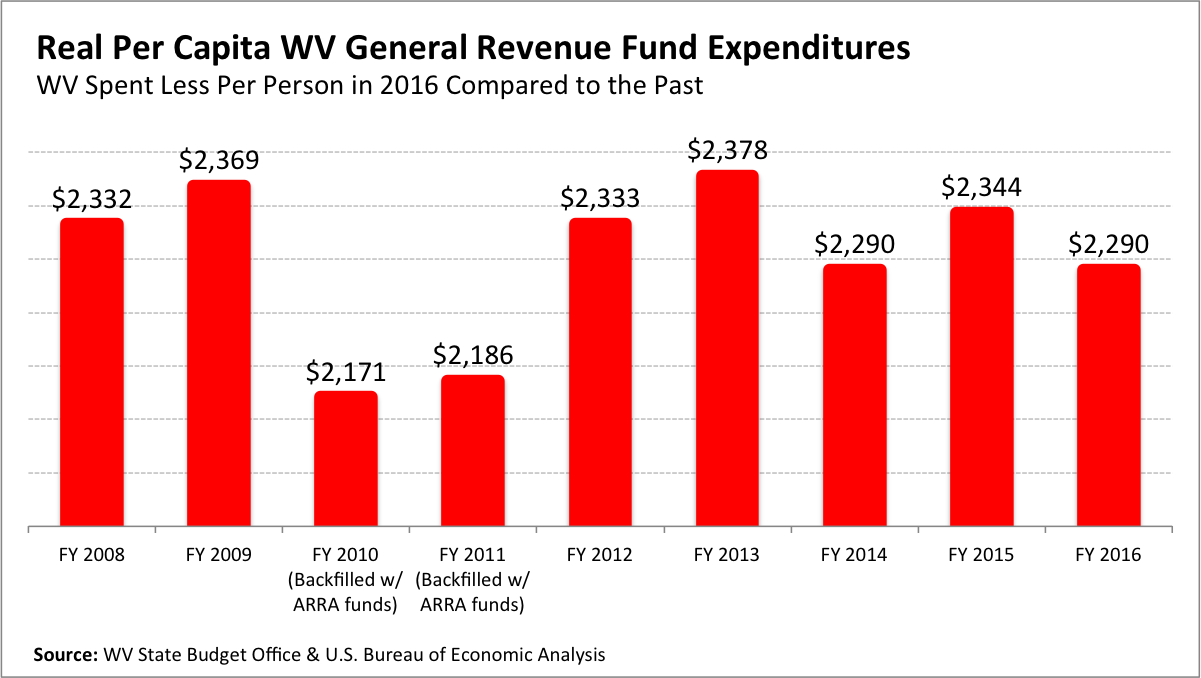
  Some policymakers have been quick to point out that West Virginia should be spending less because of its declining population. At quick look at per capita General Revenue Fund spending in West Virginia reveals the state spent less per person in 2016 compared to the past.
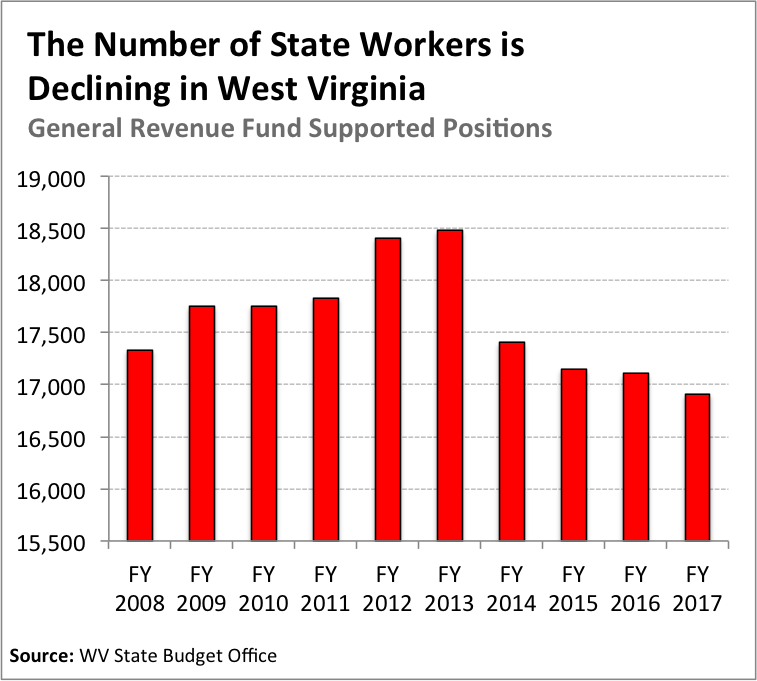
  Altogether, the West Virginia State Budget Office estimates that West Virginia has cut its budget by more than $600 million over the last five years. In the final analysis, it is pretty clear that West Virginia’s budget has been reduced over the last several years both in nominal and real (inflation-adjusted) terms. State Employment Growth is Due to Rising Tuition, Not Increased Budget Spending While some policymakers have suggested that our state government is too big because the number of people working for state government has grown, this is only true if you are looking at the growth in employment at our public colleges and universities that is funded primarily through tuition and fees, which have grown partly due to budget cuts. As the graph below highlights, total Full-Time Equivalent (FTEs) positions in state government have grown by 3,685 over the last 10 years, from 38,917 in FY 2008 to 42,145 in FY 2017. However, if you break down the number of FTEs by each spending account or revenue fund it is clear that almost all of the growth is in positions funded by Non-Appropriated Special Revenue that have increased from 8,332 to 11,470 from 2008 to 2017, an increase of 3,138. Meanwhile, state government positions funded by the GRF have declined over this period by 427 FTEs, from 17,335 in 2008 to 16,908 in 2017.
 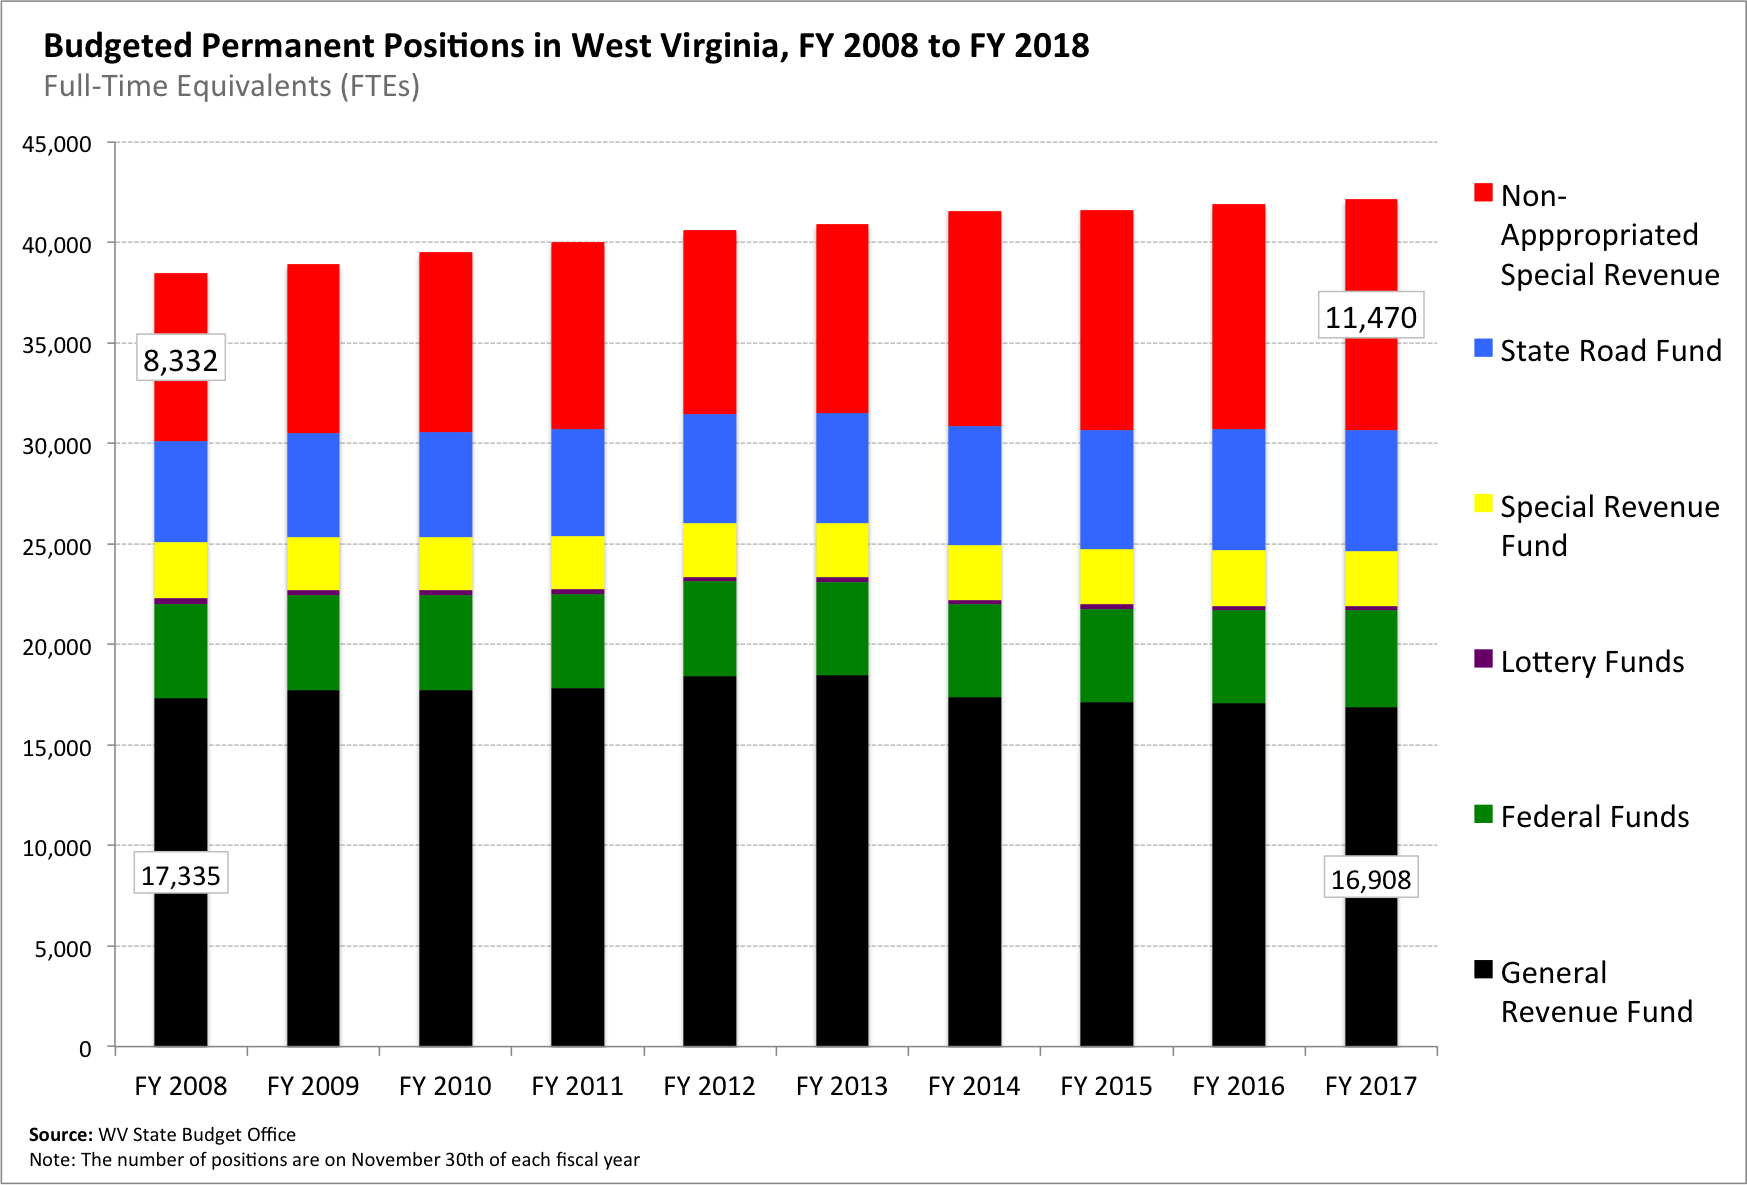 Federally funded state government position have grown by 111 FTEs from 2008 to 2017, while State Road Fund positions – which receive more than one-third of their revenues from federal funds – has grown by 908 over this period. If you just look at funds that comprise only state-source funding, the General Revenue, Lottery, and Special Revenue funds, the number of state government FTEs has declined by 544 since 2008.
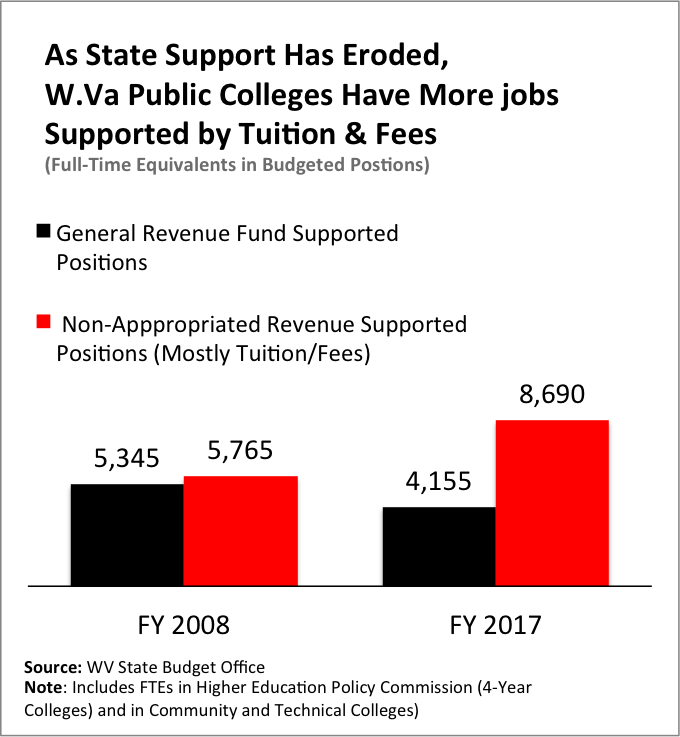
  So, what is causing the increase in state government positions in Non-Appropriated Special Revenue Funds? If you look at the data from executive budget reports, it is being driven almost entirely from Non-Appropriated Special Revenue growth in our two and four-year public colleges which is mostly made up of tuition and fees charged to students. From FY 2008 to FY 2016, Non-Appropriated Special Revenues at West Virginia’s two and four-year colleges have grown by over $450 million while General Revenue Funds have grown by less than $1 million over this period. The decline in state GRF support for higher education has partly led to an increased reliance on tuition/fees to fund the colleges and the people that work there. As the chart below shows, in 2008, there were 5,345 permanent positions at West Virginia’s public colleges funded by General Revenue expenditures compared to just 4,155 in 2017. Conversely, the number of positions at colleges funded by mostly tuition and fees rose from 5,765 to 8,690, an increase of nearly 2,925. So, while the number of people employed by our public colleges has grown, this isn’t due to more state spending at our public colleges; it due to the increase in tuition and fees that are paid by in-state and out-of-state students.
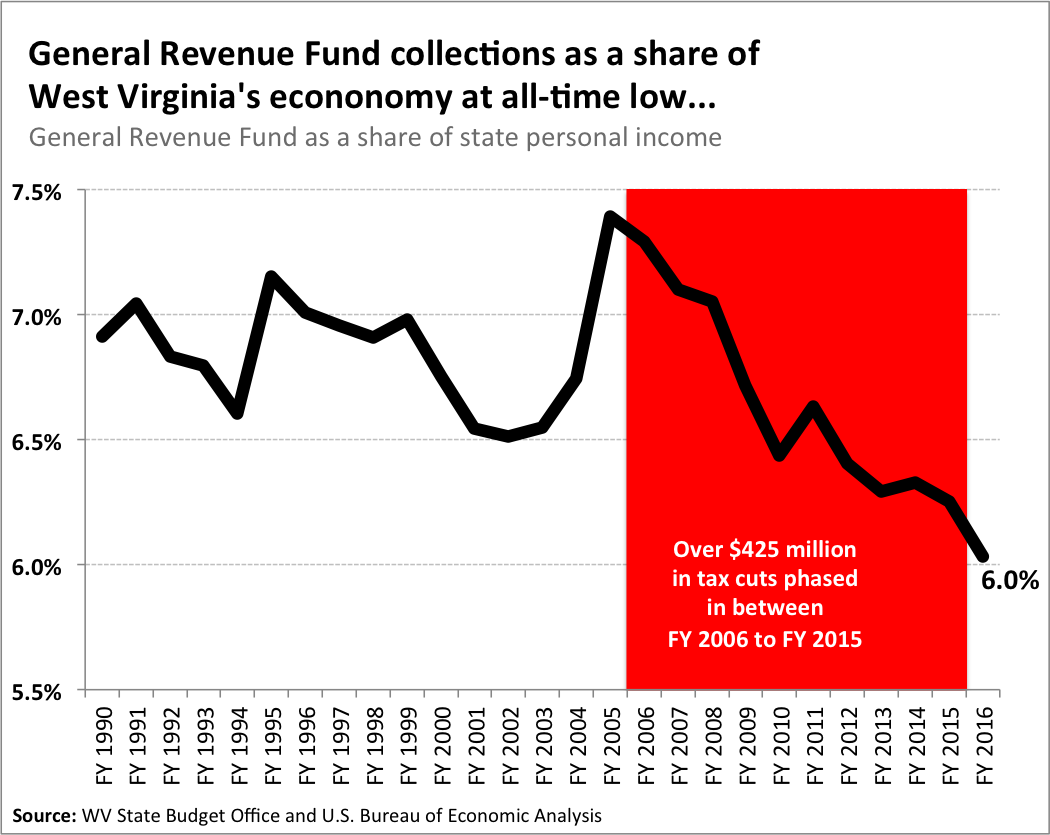
  Taxes Are a Smaller Share of our Income As discussed above, the General Revenue Fund contains most of the taxes that are collected by the state. Over the last decade, General Revenue collections in West Virginia as a share of the state economy have shrunk from a high of 7.4 percent in 2005 to just 6 percent in 2016. The drop in state revenues as a share of the economy is mostly due to large tax reductions that were phased in beginning in 2006, including the elimination of the business franchise and grocery tax and the reduction in the corporate net income tax from 9 to 6.5 percent. Before the tax cuts were enacted, General Revenue Fund collections made up on average about 7 percent of our state’s economy between 1990 and 2005. At 7 percent, West Virginia would have collected over $650 million more in General Revenue Funds in 2016 than it did.
  Moving forward, the state is going to need additional revenues to keep up with the cost of government services, which tend to grow faster than our overall economy (and for good reason). This is especially true for Medicaid and other state health care services. The state will also have to reorganize itself in some manner to deal with population shrinkage – especially in the south – and will need to take steps to lower health care costs, make college more affordable, and ensure that our classrooms are filled with better paid teachers. The one thing we should not be doing is priding ourselves on gutting state government when it will be needed now more than ever if the state is ever going to rebound in the future.