While West Virginia has experienced positive job growth over the last two years, it is imperative that we don’t use employment data incorrectly so we can have a full understanding of how West Virginia’s economy is rebounding. Unfortunately, the WV Chamber of Commerce keeps misusing employment figures to overstate West Virginia’s economic recovery. And even worse, the Chamber is linking West Virginia’s recent job growth to policies that they have helped enact, many of which have little to nothing to do with influencing jobs or economic growth – especially in the short-term. The data clearly shows that West Virginia’s economic rebound is being driven primarily from temporary growth in natural gas pipeline construction, which has virtually nothing to do with recent state public policy and everything to do with the large shale natural gas deposits below our feet. This is something we’ve written about several times.
In a recent op-ed, the Chamber says: “Total employment in West Virginia for the months of June and July reached 754,400 and 756,400 respectively, representing the best employment for those two months since 2008, before the Great Recession. Since July 2015, West Virginia has added more than 27,000 jobs, with more than 14,000 of those jobs being created just within the last year.”
Before diving into these numbers, it is first important to look at where this data comes from and how it is being (mis)used.
The data the Chamber cites is from the Local Area Unemployment Survey (LAUS) that is derived from the national Current Population Survey (CPS) conducted by the U.S. Bureau of Labor Statistics. The survey data is model-based and it relies on current and historic data from CPS, the Current Employment Statistics (CES) survey, the American Community Survey, and state unemployment insurance (UI) systems. This data is revised every year and can change dramatically. In fact, the LAUS data was just revised in April and five years or 60 months of data was revised due to “population controls, model reestimation, and new seasonal adjustment.” For a small state like West Virginia, it can be a real challenge to produce accurate employment data, especially by month.
It is important to recognize that the LAUS data is not a survey of “jobs” but a survey of unemployment that is based on a model. LAUS asks people several questions, including whether they are employment or unemployment, looking for work, and whether they are work part-time. A person that is “employed” could have several (part-time) jobs or they could live in West Virginia but work out-of-state (e.g. commuting to DC from the Martinsburg).
If you want to know how many “jobs” are in West Virginia, you have to look at either the Current Employment Statistics (CES) survey or the Quarterly Census of Employment and Wages (QCEW) which is non model based survey that is based on the actual number of people covered by unemployment insurance and the actual number of business establishments in the state. The QCEW is the most accurate survey because it is an actual census of employment, not a model based survey. While the CES program is based on a national monthly survey of 142,000 business and government establishments, the CPS-LAUS is based on a survey of just 60,000 households. So, if you are looking for more accurate data CES is going to provide a much a clearer picture of payroll employment or jobs by state since the survey is more than twice as large.
The graph below looks at seasonally adjusted employment from the LAUS program and nonfarm payroll employment with and without construction employment from the CES survey. As you can see, they tell similar but different stories. From January 2019 to July 2019, there has been no net nonfarm job growth in the CES survey while the LAUS data shows a net gain of 10,600 in employment. So, what do we make of this? Well, the LAUS data is a smaller survey and less accurate and it just gives us an estimate of how many people in West Virginia are employed not the estimated number of “jobs” in the state. Because the LAUS program uses unemployment insurance claims data to model employment, the numbers may be inflated because they are counting people that are working in West Virginia temporarily on pipeline construction that do not live in a household in West Virginia.
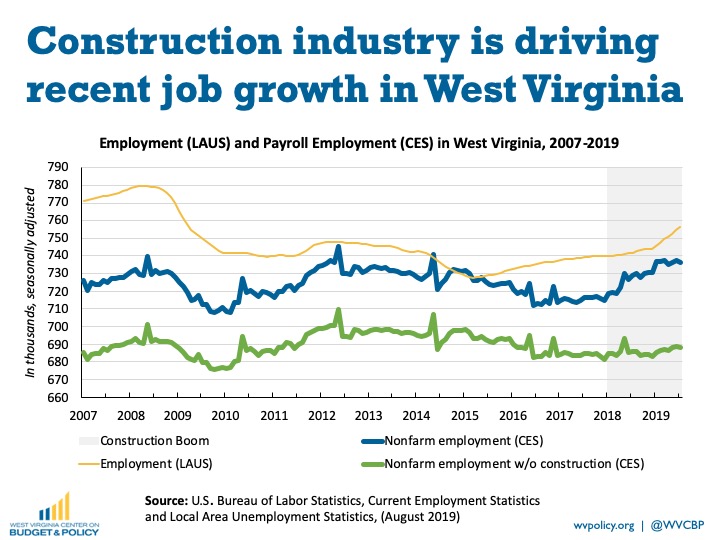
If we look at total nonfarm employment and nonfarm employment excluding construction employment, it becomes clear that the growth in construction employment is driving the state’s recent job gains over the last two years. As you can tell, if we look at total nonfarm employment (blue line) and nonfarm employment without construction employment (green line) the pattern is remarkably similar until you get to the construction boom of the last two years. In July of 2017, construction employment accounted for 4.4% of total nonfarm employment whereas in July 2019 it accounted for 6.5% – the highest share over this 12 year period (2007 to 2019).
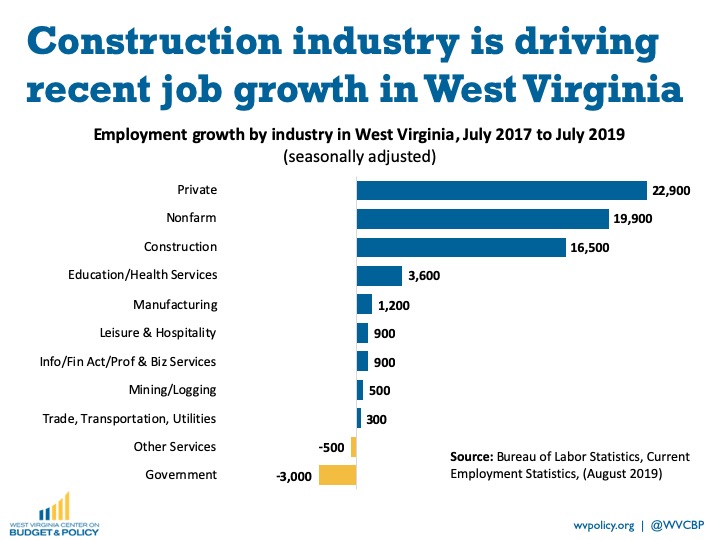
If we look at job growth over the last two years – from July 2017 to July 2019 – we can see that construction employment grew by 16,500 while total nonfarm employment grew by 19,900. All together over these last two years, the construction industry makes up 83% of the nonfarm jobs added over this period. The industry with the second largest job growth over this period was health care, which is driven mostly by government programs like Medicaid and Medicare and our aging population.
The bottom line is that West VIrginia has not “added 27,000 jobs since July 2015” or “14,000…within the last year”. This is how many more people are “employed” based on the LAUS survey, which is subject to heavy revision each year, and is not a proxy for “jobs”. The “jobs” survey is either the CES or better yet the QCEW. And furthermore, the Great Recession officially began in December 2007, so July and June 2008 is not “before the Great Recession”. According to the LAUS data, West Virginia had 775,900 people employed in December 2017. This is 21,100 fewer people in employed than in July of 2019 when employed was 756,400. Because the CES survey is larger and is a measure of the number of jobs within West Virginia, it is far better survey to look at for employment trends in the state.
A closer look at the QCEW – the most accurate data we have on the number of jobs in West Virginia – shows that oil and gas pipeline construction employment has been the driving force in construction job growth. As the chart below shows, if you pull out pipeline construction employment from total construction employment there has been only modest growth in construction employment. Pipeline construction employment grew from 14% of total construction employment in the first quarter of 2018 to a peak of 31% in the third quarter of 2018.
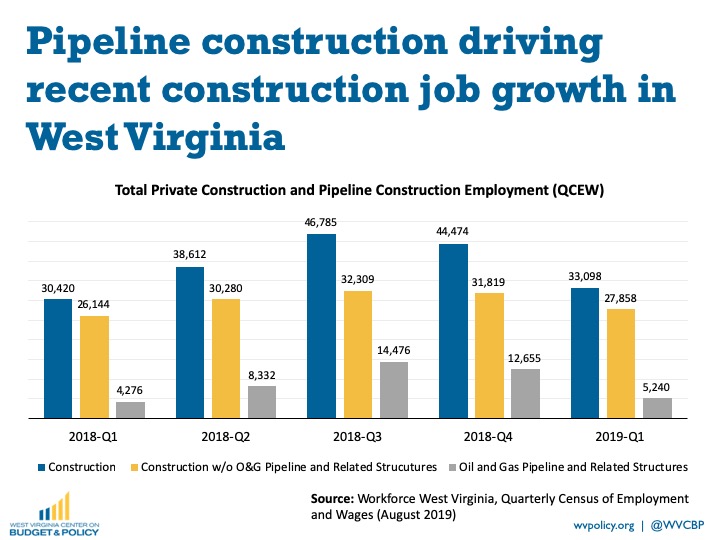
The QCEW has some fluctuation because it is not seasonally adjusted and because it’s a census of the actual employment based on those covered by unemployment insurance, with employment usually lower in the winter or the first quarter each year. That said, it is likely that pipeline construction employment will not rise back to its previous levels due to the fact that one of the major pipelines – the Mountaineer Express Pipeline (MEP) – was completed earlier this year. If the state’s recent monthly revenues are any indicator, the decline in pipeline construction jobs may be already taking place.
While it is good that West Virginia’s economy is rebounding, we should remain cautious because most of the job growth is tied up in temporary construction work on pipelines. As pipeline construction declines over the coming year, let’s hope other industries continue to grow to help cushion the decline. And let’s all be sure that we are using the best data possible to get a picture of our state’s economy.